


Edge Computing Market by Component (Hardware, Platform, Solutions), Application (Smart Cities, Location Services, Analytics, Augmented Reality), Organization Size (SME, Large Enterprises), Vertical, and Region - Global Forecast to 2022
USD 8,150 (Global-User License)

The small and medium enterprises (SMEs) segment is expected to grow at a higher CAGR during the forecast period. SMEs have been majorly dependent on data centers to process and analyze their data. However, budget constraints have been a major obstacle for SMEs to adopt data center services. Transferring and processing the data over the cloud increases the operational cost. Edge computing facilitates SMEs to collect, process, and store data at the edge of the network closer to the source. This further reduces the operational costs of managing and storing data for SMEs, thus encouraging SMEs to adopt edge computing solutions and services.
The augmented reality application is likely to gain traction in the edge computing application segment. Augmented reality is one of the trending application that is expected to gain demand in the coming years across different industries such as retail, manufacturing, media and entertainment, and healthcare and life sciences. Augmented reality applications require high computing power in order to avoid delays. Edge computing plays a vital role in providing high computing power to augmented reality applications.
The edge computing solutions and services are being increasingly adopted across various industry verticals, which have led to the growth of the market globally. The consumer goods and retail sector is expected to grow at the highest rate from 2017 to 2022.
North America is expected to hold the largest market share and dominate the edge computing market from 2017 to 2022. The region also has a high concentration of telecom and IT and manufacturing industries that largely contribute to the adoption of edge computing solutions and services. However, the APAC region is considered to provide high growth opportunities for edge computing vendors. This can be majorly attributed to the rapid technological development and government initiatives to promote digitization across industries with an objective to optimize resources and increase profitability in the developing countries.
The major solution and service providers in the edge computing market include Nokia Networks (Finland), Huawei (China), Juniper Networks (US), Dell (US), Cisco Systems (US), HPE (US), SixSq Sàrl (Switzerland), FogHorn Systems (US), Vasona Networks (US), MachineShop Inc. (US), Saguna Networks (Israel), Vapor IO (US), Xiotech (US), Mirror Image (US), Aricent (US), and ADLINK Technology (US). These players have adopted various strategies, such as new product launches, product upgradations, and partnerships with technology companies to cater to the needs of the edge computing users.
1 Introduction (Page No. - 13)
1.1 Objectives of the Study
1.2 Market Definition
1.3 Market Scope
1.4 Years Considered for the Study
1.5 Currency
1.6 Stakeholders
2 Research Methodology (Page No. - 17)
2.1 Research Data
2.1.1 Secondary Data
2.1.2 Primary Data
2.1.2.1 Breakdown of Primaries
2.1.2.2 Key Industry Insights
2.2 Market Size Estimation
2.3 Research Assumptions and Limitations
2.3.1 Research Assumptions
2.3.2 Limitations
3 Executive Summary (Page No. - 23)
4 Premium Insights (Page No. - 26)
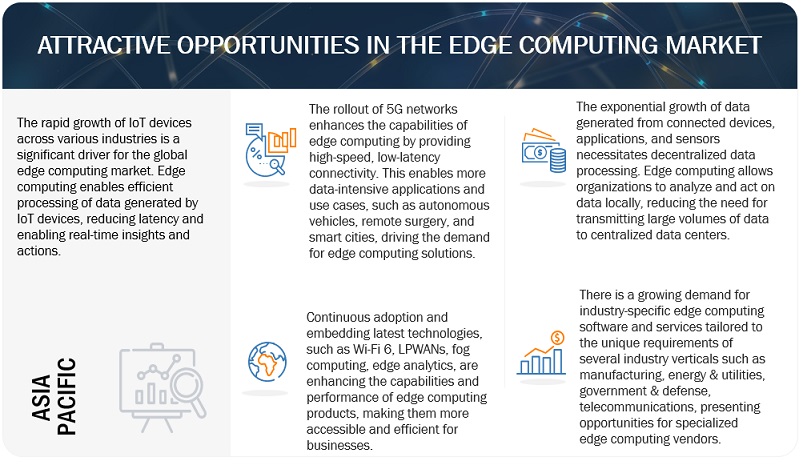
4.1 Attractive Market Opportunities in the Edge Computing Market
4.2 Market By Vertical and Region
4.3 Market By Organization Size
4.4 Market By Component
4.5 Market By Organization Size
4.6 Market By Region
4.7 Lifecycle Analysis, By Region (2017)
5 Market Overview (Page No. - 30)
5.1 Introduction
5.2 Innovation Spotlight
5.3 Market Dynamics
5.3.1 Drivers
5.3.1.1 Growing Load on the Cloud Infrastructure
5.3.1.2 Wide Range of Applications in Different Industries
5.3.1.3 Increase in the Number of Intelligent Applications
5.3.2 Restraints
5.3.2.1 Security and Privacy Concerns Related to Edge Computing
5.3.3 Opportunities
5.3.3.1 Advent of the 5g Network
5.3.4 Challenges
5.3.4.1 Inadequate Industry Standards and Interoperability Issues
5.4 Ecosystem
6 Edge Computing Market Analysis, By Component (Page No. - 34)
6.1 Introduction
6.2 Hardware
6.3 Gateways
6.4 Micro Data Centers
6.5 Platform
6.6 Solution
6.7 Services
6.7.1 Consulting
6.7.2 System Integration and Testing
6.7.3 Technical Support
7 Edge Computing Market Analysis, By Application (Page No. - 42)
7.1 Introduction
7.2 Smart Cities
7.3 Location Services
7.4 Analytics
7.5 Environmental Monitoring
7.6 Optimized Local Content
7.7 Data Caching
7.8 Augmented Reality
7.9 Others
8 Edge Computing Market Analysis, By Organization Size (Page No. - 50)
8.1 Introduction
8.2 Small and Medium-Sized Enterprises
8.3 Large Enterprises
9 Edge Computing Market Analysis, By Vertical (Page No. - 54)
9.1 Introduction
9.2 Manufacturing
9.3 Healthcare
9.4 Transportation
9.5 Government and Public
9.6 Media and Entertainment
9.7 Energy and Utilities
9.8 Telecom and It
9.9 Retail
9.10 Others
10 Geographic Analysis (Page No. - 65)
10.1 Introduction
10.2 North America
10.3 Europe
10.4 Asia Pacific
10.5 Middle East and Africa
10.6 Latin America
11 Competitive Landscape (Page No. - 86)
11.1 Overview
11.2 Market Ranking Analysis
11.3 Competitive Scenario
11.3.1 New Product Launches
11.3.2 Expansions
11.3.3 Mergers and Acquisitions
11.3.4 Agreements and Partnerships
12 Company Profiles (Page No. - 90)
(Business Overview, Products Offered, Recent Developments, SWOT Analysis, MnM View)*
12.1 Cisco
12.2 Nokia Networks
12.3 Huawei
12.4 Dell
12.5 HPE
12.6 Sixsq
12.7 Foghorn Systems
12.8 Vasona Networks
12.9 Machineshop
12.10 Saguna Networks
12.11 Vapor Io
12.12 Xiotech Corporation
12.13 Adlink Technology
12.14 Mirror Image Internet
12.15 Aricent
12.16 Juniper Networks
*Details on Business Overview, Products Offered, Recent Developments, SWOT Analysis, MnM View Might Not Be Captured in Case of Unlisted Companies.
13 Appendix (Page No. - 121)
13.1 Key Industry Insights
13.2 Discussion Guide
13.3 Knowledge Store: Marketsandmarkets’ Subscription Portal
13.4 Introducing RT: Real-Time Market Intelligence
13.5 Related Reports
13.6 Author Details
List of Tables (60 Tables)
Table 1 United States Dollar Exchange Rate, 2014–2016
Table 2 Edge Computing Market Size and Growth Rate, 2015–2022 (USD Million, Y-O-Y %)
Table 3 Edge Computing Market Size, By Component, 2015–2022 (USD Million)
Table 4 Hardware: Market Size, By Region, 2015–2022 (USD Million)
Table 5 Platform: Market Size, By Region, 2015–2022 (USD Million)
Table 6 Solution: Market Size, By Region, 2015–2022 (USD Million)
Table 7 Services: Market Size, By Type, 2015–2022 (USD Million)
Table 8 Consulting Services Market Size, By Region, 2015–2022 (USD Million)
Table 9 System Integration and Testing Market Size, By Region, 2015–2022 (USD Million)
Table 10 Technical Support Market Size, By Region, 2015–2022 (USD Million)
Table 11 Edge Computing Market Size, By Application, 2015–2022 (USD Million)
Table 12 Smart Cities: Market Size, By Region, 2015–2022 (USD Million)
Table 13 Location Services: Market Size, By Region, 2015–2022 (USD Million)
Table 14 Analytics: Market Size, By Region, 2015–2022 (USD Million)
Table 15 Environmental Monitoring: Market Size, By Region, 2015–2022 (USD Million)
Table 16 Optimized Local Content: Market Size, By Region, 2015–2022 (USD Million)
Table 17 Data Caching: Market Size, By Region, 2015–2022 (USD Million)
Table 18 Augmented Reality: Market Size, By Region, 2015–2022 (USD Million)
Table 19 Others: Market Size, By Region, 2015–2022 (USD Million)
Table 20 Small and Medium-Sized Enterprises Segment is Expected to Grow at A Higher CAGR During the Forecast Period
Table 21 Edge Computing Market Size, By Organization Size, 2015–2022 (USD Million)
Table 22 Small and Medium-Sized Enterprises: Market Size, By Region, 2015–2022 (USD Million)
Table 23 Large Enterprises: Market Size, By Region, 2015–2022 (USD Million)
Table 24 Edge Computing Market Size, By Vertical, 2015–2022 (USD Million)
Table 25 Manufacturing: Market Size, By Region, 2015–2022 (USD Million)
Table 26 Healthcare: Market Size, By Region, 2015–2022 (USD Million)
Table 27 Transportation: Market Size, By Region, 2015–2022 (USD Million)
Table 28 Government and Public: Market Size, By Region, 2015–2022 (USD Million)
Table 29 Media and Entertainment: Market Size, By Region, 2015–2022 (USD Million)
Table 30 Energy and Utilities: Market Size, By Region, 2015–2022 (USD Million)
Table 31 Telecom and It: Market Size, By Region, 2015–2022 (USD Million)
Table 32 Retail: Market Size, By Region, 2015–2022 (USD Million)
Table 33 Others: Market Size, By Region, 2015–2022 (USD Million)
Table 34 Edge Computing Market Size, By Region, 2015–2022 (USD Million)
Table 35 North America: Market Size, By Component, 2015–2022 (USD Million)
Table 36 North America: Market Size, By Service, 2015–2022 (USD Million)
Table 37 North America: Market Size, By Application, 2015–2022 (USD Million)
Table 38 North America: Market Size, By Organization Size, 2015–2022 (USD Million)
Table 39 North America: Market Size, By Vertical, 2015–2022 (USD Million)
Table 40 Europe: Edge Computing Market Size, By Component, 2015–2022 (USD Million)
Table 41 Europe: Market Size, By Service, 2015–2022 (USD Million)
Table 42 Europe: Market Size, By Application, 2015–2022 (USD Million)
Table 43 Europe: Market Size, By Organization Size, 2015–2022 (USD Million)
Table 44 Europe: Market Size, By Vertical, 2015–2022 (USD Million)
Table 45 Asia Pacific: Edge Computing Market Size, By Component, 2015–2022 (USD Million)
Table 46 Asia Pacific: Market Size, By Service, 2015–2022 (USD Million)
Table 47 Asia Pacific: Market Size, By Application, 2015–2022 (USD Million)
Table 48 Asia Pacific: Market Size, By Organization Size, 2015–2022 (USD Million)
Table 49 Asia Pacific: Market Size, By Vertical, 2015–2022 (USD Million)
Table 50 Middle East and Africa: Market Size, By Component, 2015–2022 (USD Million)
Table 51 Middle East and Africa: Market Size, By Service, 2015–2022 (USD Million)
Table 52 Middle East and Africa: Market Size, By Application, 2015–2022 (USD Million)
Table 53 Middle East and Africa: Market Size, By Organization Size, 2015–2022 (USD Million)
Table 54 Middle East and Africa: Market Size, By Vertical, 2015–2022 (USD Million)
Table 55 Latin America: Edge Computing Market Size, By Component, 2015–2022 (USD Million)
Table 56 Latin America: Market Size, By Service, 2015–2022 (USD Million)
Table 57 Latin America: Market Size, By Application, 2015–2022 (USD Million)
Table 58 Latin America: Market Size, By Organization Size, 2015–2022 (USD Million)
Table 59 Latin America: Market Size, By Vertical, 2015–2022 (USD Million)
Table 60 Market Ranking for the Edge Computing Market
List of Figures (27 Figures)
Figure 1 Edge Computing Market Segmentation
Figure 2 Regional Scope
Figure 3 Edge Computing Market: Research Design
Figure 4 Data Triangulation
Figure 5 Market Size Estimation Methodology: Bottom-Up Approach
Figure 6 Market Size Estimation Methodology: Top-Down Approach
Figure 7 Edge Computing Market: Assumptions
Figure 8 Top 3 Categories With the Largest Market Shares in the Market in 2017
Figure 9 North America is Estimated to Have the Largest Share of the Market in 2017
Figure 10 Increase in the Number of Intelligent Applications is Expected to Be A Major Driving Factor for the Growth of the Edge Computing Market
Figure 11 Telecom and It Vertical, and North America are Estimated to Have the Largest Market Shares in 2017
Figure 12 Small and Medium-Sized Enterprises Segment is Expected to Grow at A Higher CAGR in the Edge Computing Market During the Forecast Period
Figure 13 Hardware Component is Expected to Grow at the Highest CAGR During the Forecast Period
Figure 14 Large Enterprises Segment is Estimated to Account for A Larger Market Size in 2017
Figure 15 Asia Pacific is Expected to Grow at the Highest CAGR During the Forecast Period
Figure 16 Asia Pacific is Expected to Be the Fastest-Growing Region in the Edge Computing Market
Figure 17 Edge Computing Market: Drivers, Restraints, Opportunities, and Challenges
Figure 18 Edge Computing Ecosystem
Figure 19 Hardware Component is Expected to Grow at the Highest CAGR During the Forecast Period
Figure 20 System Integration and Testing Service is Expected to Grow at the Highest CAGR During the Forecast Period
Figure 21 Augmented Reality Application is Expected to Grow at the Highest CAGR During the Forecast Period
Figure 22 Retail Vertical is Expected to Grow at the Highest CAGR During the Forecast Period
Figure 23 Asia Pacific is Expected to Grow at the Highest CAGR During the Forecast Period
Figure 24 Regional Snapshot: Asia Pacific is Expected to Be the Emerging Region in the Edge Computing Market
Figure 25 North America: Market Snapshot
Figure 26 Asia Pacific: Market Snapshot
Figure 27 Key Developments By Leading Players in the Edge Computing Market for 2014–2017
